
Exhibition time: 17-19 March, 2026 Shanghai, China
 中文
中文

Exhibition time: 17-19 March, 2026 Shanghai, China
 中文
中文
The U.S. is a major player in agriculture and accounts for approximately 10-15% of total global fertilizer consumption. US fertilizer consumption needs are met through a mix of domestic production and imports, with the balance varying by nutrient type.
Previous articles in this series have examined trends in fertilizer use and efficiency and drivers of fertilizer application rates and farmer decision-making (see farmdoc daily, May 29, 2025; July 22, 2025). This article shifts the focus to the structure of the global and U.S. fertilizer industries. We explore how supply chains, production dynamics, and trade dependencies impact supply risk, discussing implications for U.S. farmers.
Global Fertilizer Market
The global market for nitrogen (N), phosphorus (P), and potassium (K) fertilizers has grown steadily in the last 25 years, with world production growing at a compound annual growth rate (CAGR) of approximately 1.8%. In the U.S., production of nitrogen fertilizers has increased since 2000 but total fertilizer production has declined due to reductions in production of potassium and phosphorus fertilizers.
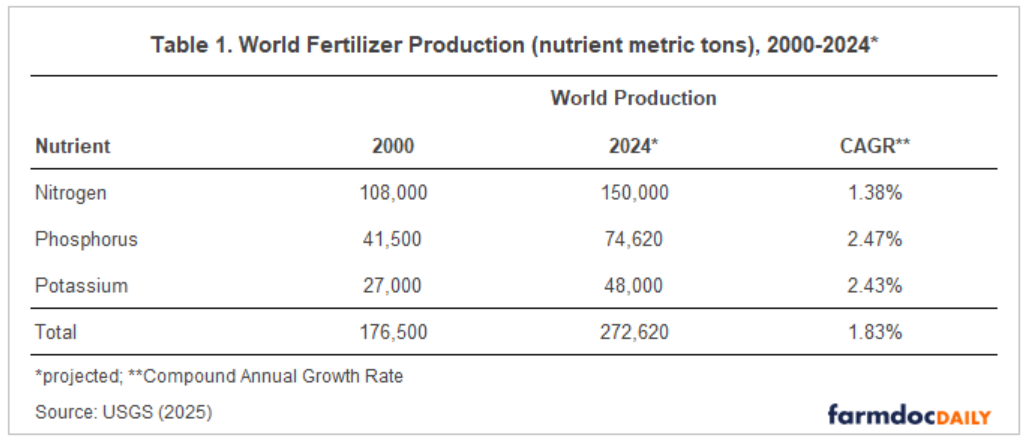
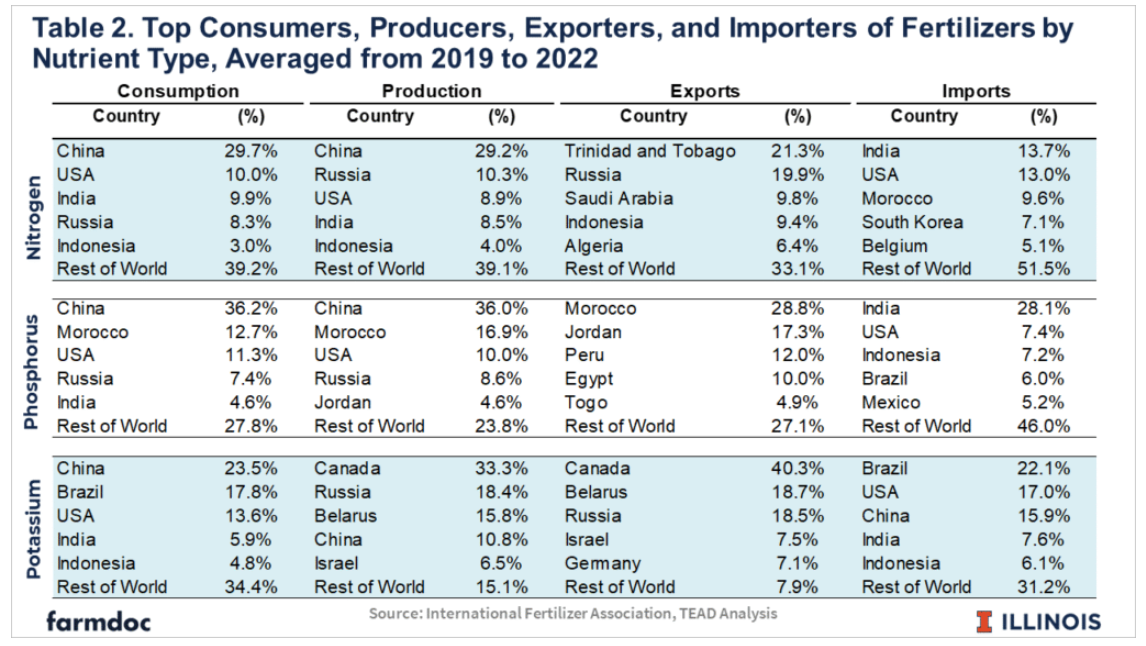
China, Russia, the United States, India, and Canada collectively produce over 60% of the world’s fertilizer nutrients. Among these, China alone contributes approximately 25%, while Russia and the United States each account for less than 10%. Table 2 summarizes average shares of global consumption, production, and trade (exports and imports) for the top countries by nutrient type.
Nitrogen fertilizers rely heavily on natural gas for production, particularly through the Haber-Bosch process (see farmdoc daily February 17, 2021), which limits production capabilities in countries with expensive or limited natural gas supplies.
In contrast, phosphorus and potassium are mined minerals with reserves concentrated in specific regions. More than one-third of global phosphorus fertilizer is produced in China, more than double that produced Morocco, the second largest global producer. Potassium production is particularly concentrated, with two-thirds of production and global reserves located in Canada, Russia, and Belarus.
The big agricultural powerhouses of China, India, U.S., Russia, and Brazil account for nearly half of the world’s consumption. Total world consumption has been growing approximately 1.6% annually.
Global trade in fertilizers is significant, accounting for 10-15% of total production of nitrogen and phosphorus, and 75% for potassium. Brazil, India and the U.S. rank in the top 5 in terms of imports for each nutrient type, reflecting the large demand in those markets. Canada is a major potassium fertilizer producer and exporter, due to its large reserves. Russia and Belarus also play major roles as potassium producers and exporters. For phosphorus, Morocco, Jordan, Peru and Egypt account for roughly two-thirds of world exports.
U.S. Domestic Fertilizer Industry
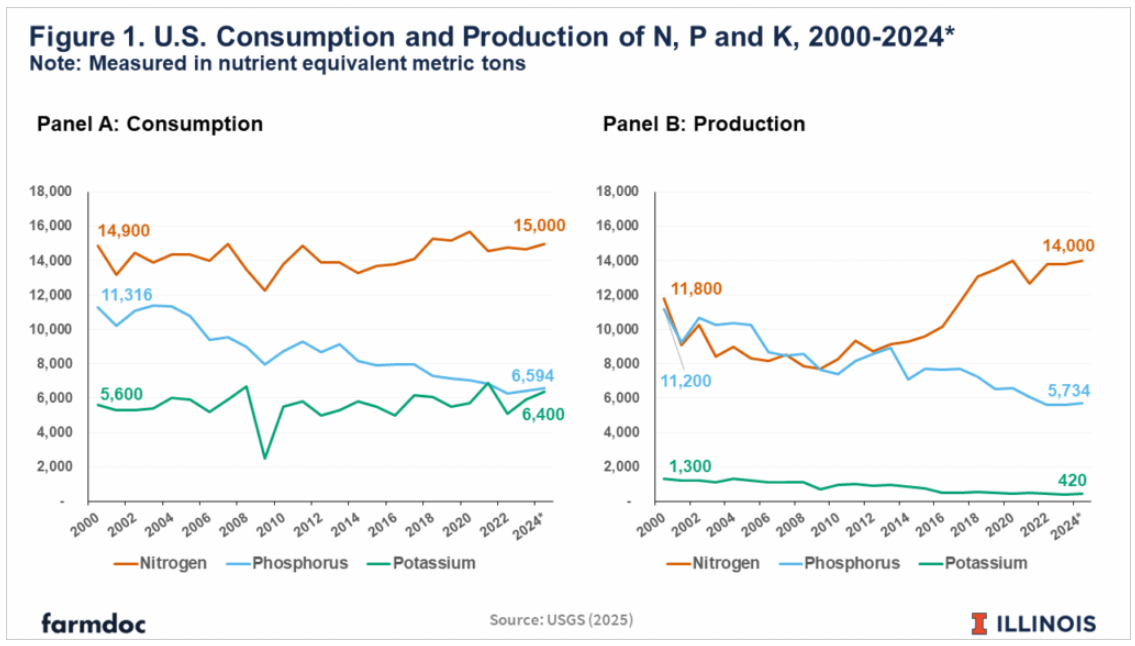
As discussed above, the U.S. is a major fertilizer producer, consumer, and importer. The U.S. has been steadily increasing its fertilizer consumption, primarily due to increasing crop production, particularly for crops like corn and wheat. As illustrated in Figure 1 (Panel A), total estimated consumption of N, P, and K in 2024 was 15,000, 6,594 and 6,400 metric tons of nutrient equivalent, respectively.
The U.S. is a major producer of nitrogen, and its production has increased 0.71% annually from 2000 to 2024, reaching a projected 14,000 metric tons in 2024. In contrast, U.S. production of phosphorus and potassium has trended down since 2000 as illustrated in Figure 1 (Panel B).
The result is that the U.S. relies on a mix of production and imports to supply its fertilizer demand. Figure 2 shows the average net import reliance (measured as imports minus exports plus/minus stock adjustments, shown as a percent of consumption) for U.S. fertilizer consumption by nutrient from 2000 to 2024.
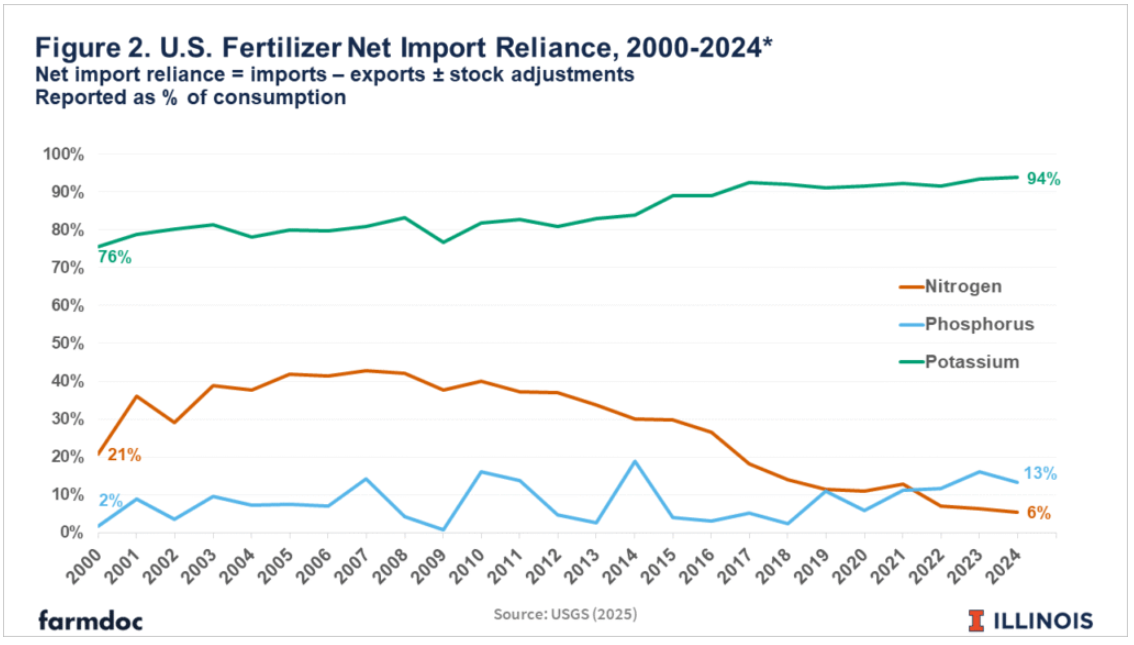
The import reliance for potash is large, growing from 75.6% in 2000, to 93.8% in 2024. While import reliance for phosphorus is much lower, it has increased from 1.7% in 2000 to 13.3% in 2024. Nitrogen is the only major nutrient for which net import reliance has declined, in relative terms, over time from over 20% in 2000 to a projected 5.5% for 2024.
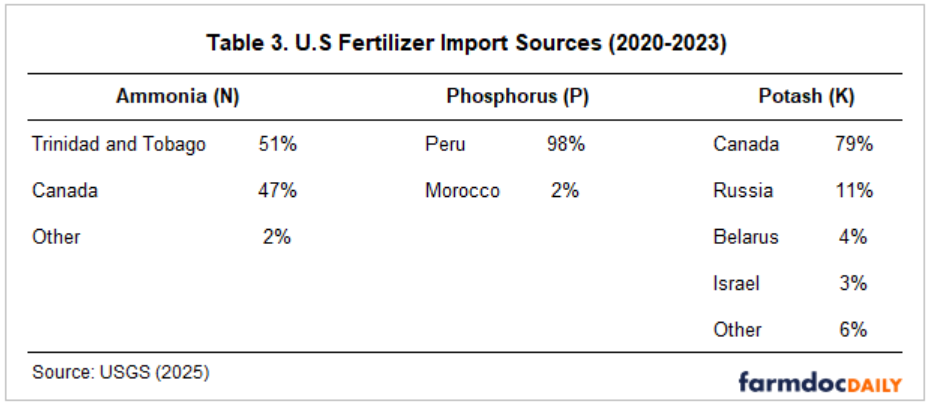
For phosphorus and potash imports, the U.S. relies heavily on Peru and Canada, respectively. For nitrogen the U.S. mainly relies on a balanced mix between Trinidad and Tobago and Canada, as shown in Table 3.
Discussion
Over the past 25 years, the global fertilizer market has steadily expanded. China, the U.S., Brazil, and India have emerged as major consumers, while China, Russia, the U.S., and Canada are key producers. However, despite their production capacity, countries like China, the U.S., Brazil and India continue to rely on imports to meet their fertilizer needs.
In the U.S., nitrogen and potash consumption has remained relatively flat, while phosphorus usage has declined. Crop production in the U.S. has continued to increase, mainly through productivity improvements (higher crop yields) as cropland acreage has been relatively stable. This implies increased fertilizer efficiency for U.S. crop production (see farmdoc daily May 29, 2025).
To meet domestic demand, the U.S. relies on a mix of production and imports. Notably, ammonia production has increased over the past 25 years, significantly reducing relative net import reliance. That places the U.S. in a better position in terms of exposure to global conflicts and disruptions that might affect farmers’ access to nitrogen fertilizers.
However, as a global commodity, U.S. farmers still face significant price volatility. Price spikes—like those in 2022 (see farmdoc daily April 5, 2022 and September 12, 2023)— remain possible since production and global trade can be impacted by policy uncertainty (see farmdoc daily, February 4, 2025). Moreover, disruptions in large competitors such as Brazil, India and China can greatly impact global fertilizer prices.
In contrast, both domestic production and consumption of phosphorus have declined over time. Imports now account for more than 13% of the U.S. consumption (compared with less than 2% in 2000), with significant reliance on imports from Peru (98%). This heavy concentration on a single foreign supplier could present future supply risks.
The U.S. relies heavily on imports to meet its potassium demand. Canada supplies nearly 80% of U.S. imports, with another 15% being sourced from Russia and Belarus. The U.S. could face future supply risks with these partners. Examples include the Russia-Ukraine conflict (see farmdoc daily April 5, 2022) and ongoing tariff threats and uncertainty (see farmdoc daily, February 4, 2025). With net imports representing 94% of phosphorus consumption, trade disruptions could result in immediate and large impacts on supply and prices.
In 2025, fertilizer costs are projected to be 40% and 28% of total direct costs for corn and soybeans, respectively, in Central Illinois (see farmdoc daily June 3, 2025). While fertilizer prices are not the only factor influencing fertilizer use decisions (see farmdoc daily July 22, 2025), understanding the structure and risks of the U.S. fertilizer industry is essential. While farmers do not have direct control over the risks surrounding global fertilizer markets, understanding those markets can help to better manage those risks (see farmdoc daily August 15, 2023).
References
Monaco, H., N. Paulson and G. Schnitkey. "Factors Influencing Nitrogen Fertilizer Application Rates and Timing in Illinois." farmdoc daily (15):133, Department of Agricultural and Consumer Economics, University of Illinois at Urbana-Champaign, July 22, 2025.
Monaco, H., N. Paulson and G. Schnitkey. "Trends in Fertilizer Use and Efficiency in the U.S." farmdoc daily (15):98, Department of Agricultural and Consumer Economics, University of Illinois at Urbana-Champaign, May 29, 2025.
Schnitkey, G., N. Paulson, C. Zulauf, K. Swanson, J. Colussi and J. Baltz. "Nitrogen Fertilizer Prices and Supply in Light of the Ukraine-Russia Conflict." farmdoc daily (12):45, Department of Agricultural and Consumer Economics, University of Illinois at Urbana-Champaign, April 5, 2022.
Paulson, N., G. Schnitkey and C. Zulauf. "Where Might Nitrogen Fertilizer Prices Be Headed?" farmdoc daily (14):114, Department of Agricultural and Consumer Economics, University of Illinois at Urbana-Champaign, June 18, 2024.
Paulson, N., G. Schnitkey, C. Zulauf and J. Coppess. "Tariff Threats and US Fertilizer Imports." farmdoc daily (15):21, Department of Agricultural and Consumer Economics, University of Illinois at Urbana-Champaign, February 4, 2025.
Paulson, N., G. Schnitkey, B. Zwilling and C. Zulauf. "Spring Revision to 2025 Illinois Crop Budgets." farmdoc daily (15):101, Department of Agricultural and Consumer Economics, University of Illinois at Urbana-Champaign, June 3, 2025.
Paulson, N., C. Zulauf, G. Schnitkey, J. Colussi and J. Baltz. "How Historic Were Fertilizer Prices in 2022?" farmdoc daily (13):165, Department of Agricultural and Consumer Economics, University of Illinois at Urbana-Champaign, September 12, 2023.
Paulson, N., G. Schnitkey, C. Zulauf, J. Colussi and J. Baltz. "Fertilizer Prices Continue Decline and May Impact Farmers’ Nitrogen Decisions." farmdoc daily (13):150, Department of Agricultural and Consumer Economics, University of Illinois at Urbana-Champaign, August 15, 2023.
Sellars, S. and V. Nunes. "Synthetic Nitrogen Fertilizer in the U.S." farmdoc daily (11):24, Department of Agricultural and Consumer Economics, University of Illinois at Urbana-Champaign, February 17, 2021.
U.S. Geological Survey. (n.d.). Nitrogen statistics and information. National Minerals Information Center. Retrieved July 22, 2025, from https://www.usgs.gov/centers/national-minerals-information-center/nitrogen-statistics-and-information
U.S. Geological Survey. (n.d.). Potash statistics and information. National Minerals Information Center. Retrieved July 22, 2025, from https://www.usgs.gov/centers/national-minerals-information-center/potash-statistics-and-information
U.S. Geological Survey. (n.d.). Phosphate‑rock statistics and information. National Minerals Information Center. Retrieved July 22, 2025, from https://www.usgs.gov/centers/national-minerals-information-center/phosphate-rock-statistics-and-information
United States Department of Agriculture, Foreign Agricultural Service. (n.d.). Global fertilizer trade dashboard [Data visualization]. Retrieved July 22, 2025, from https://www.fas.usda.gov/data/visualization-global-fertilizer-trade-dashboard
Source:farmdocdaily.illinois.edu